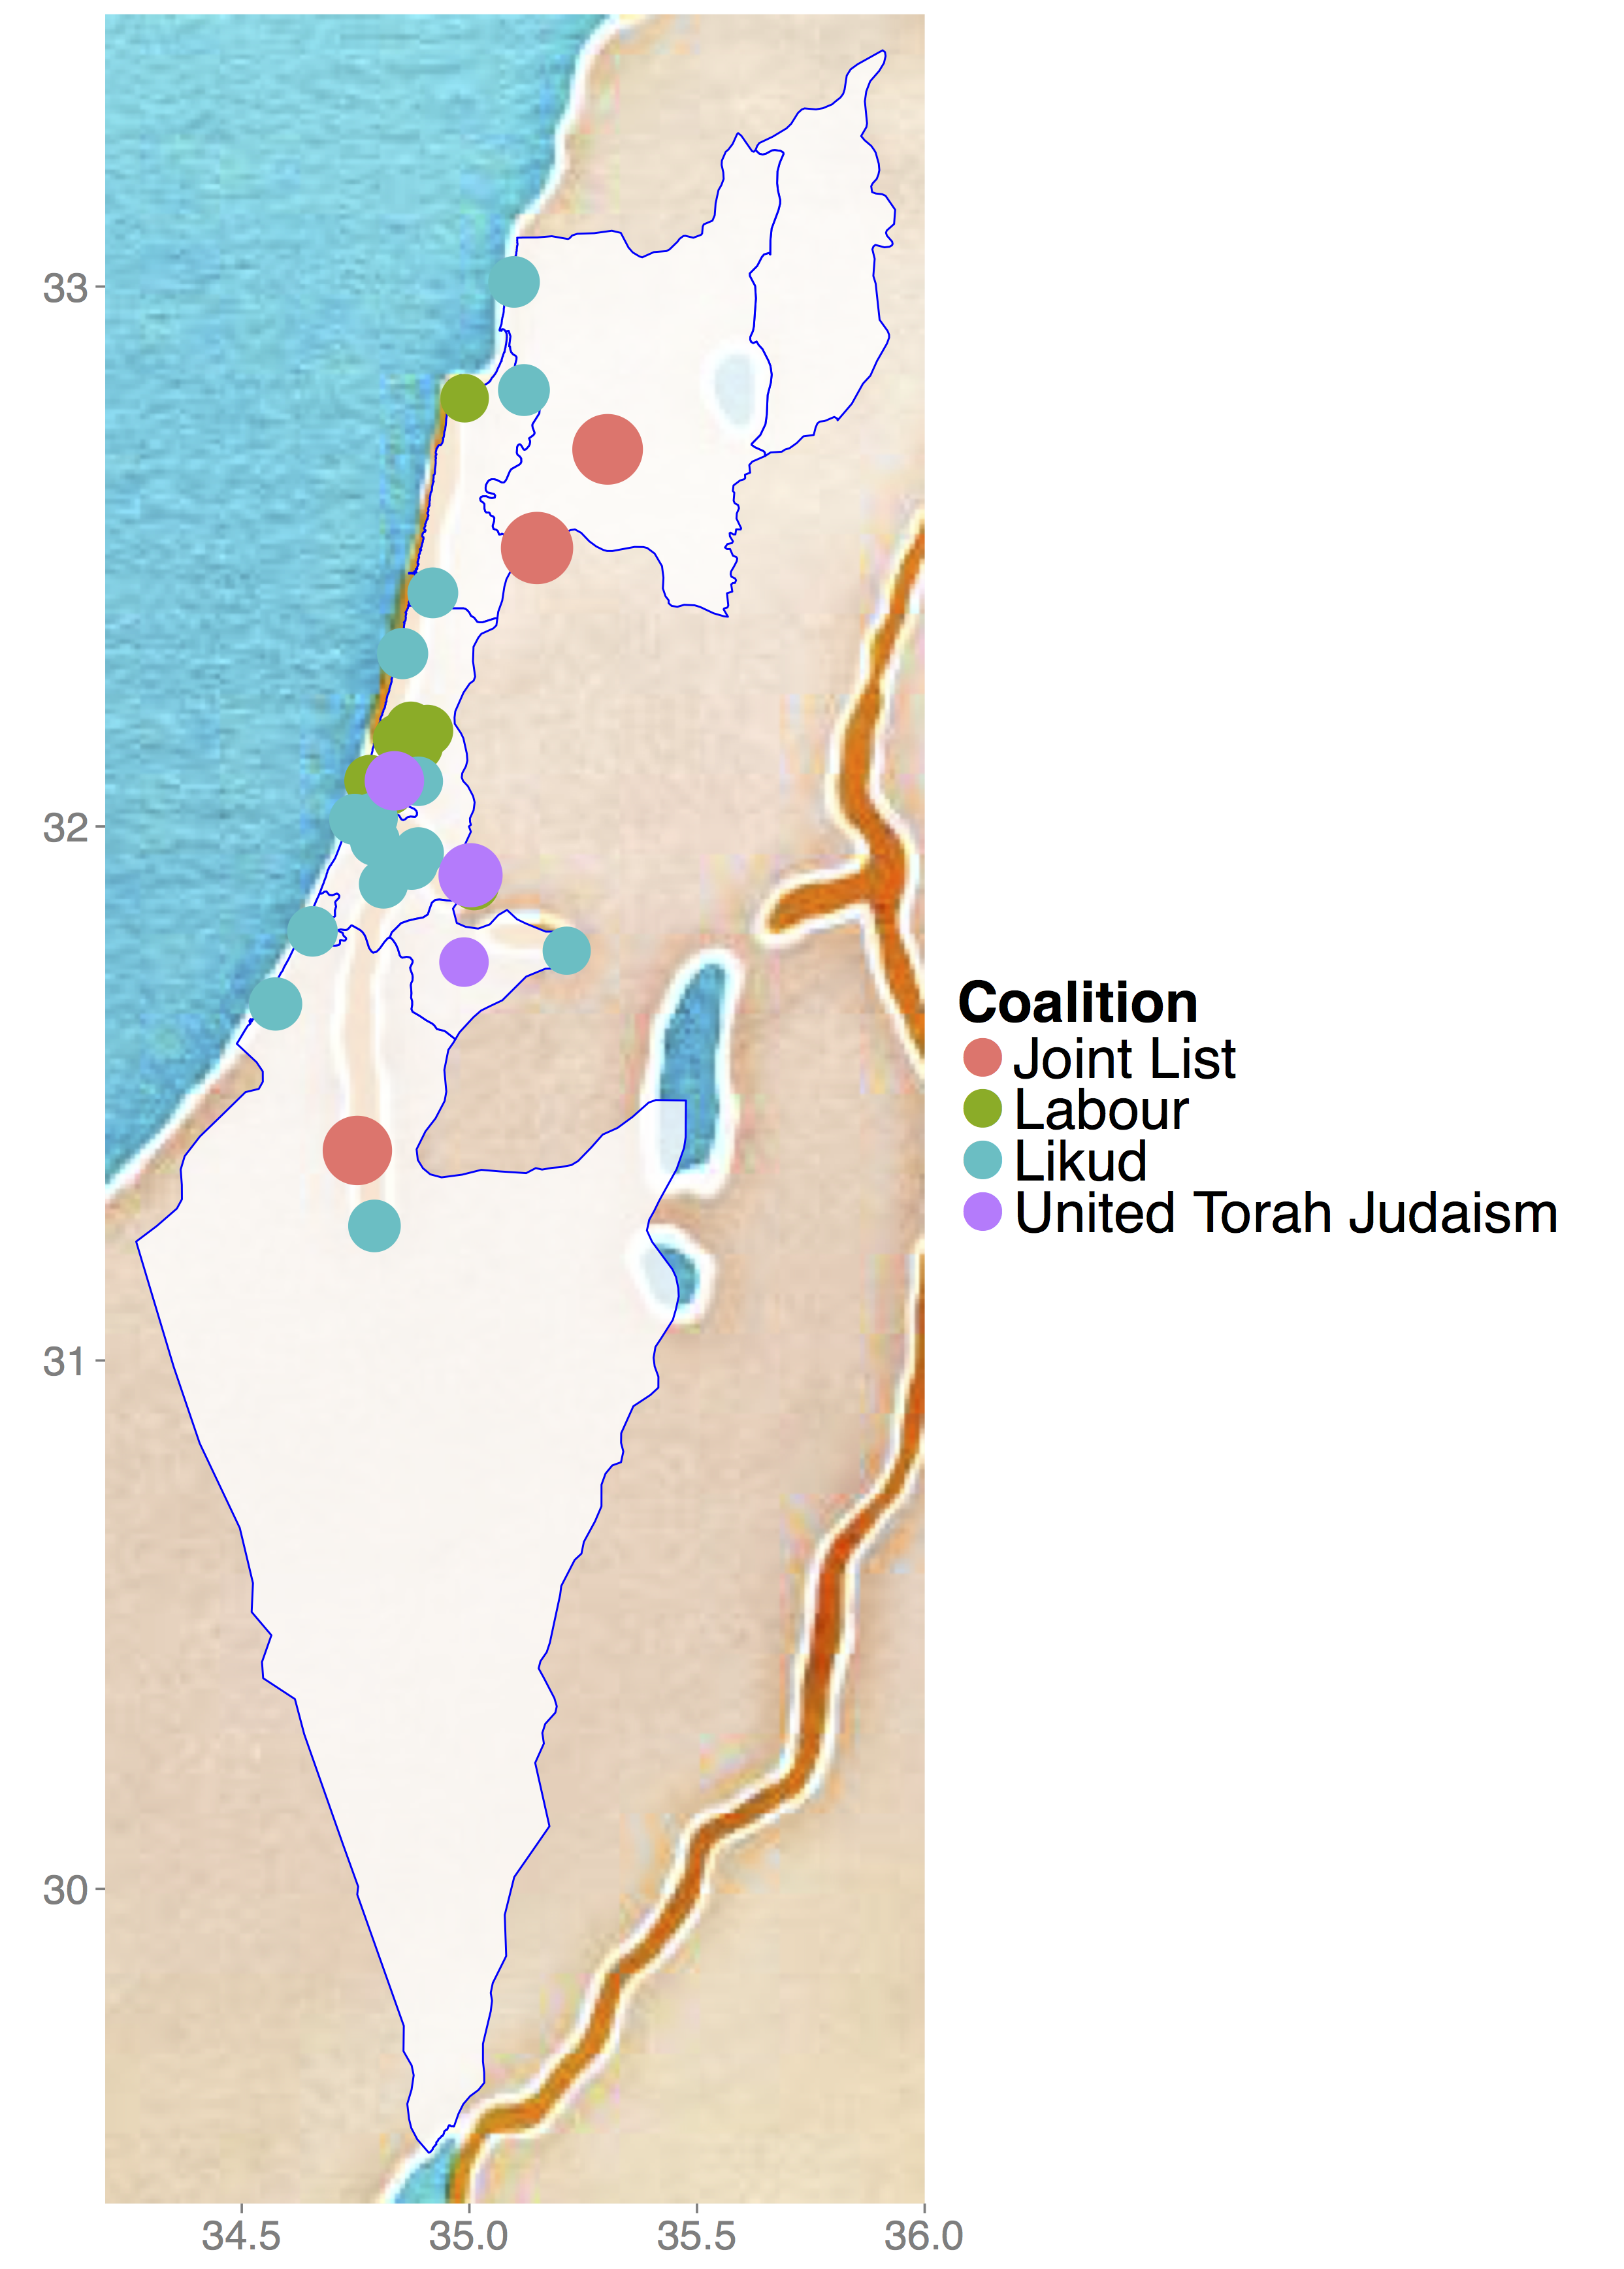
 The recent Israeli elections are a reminder of how Demography and Space play a crucial role in the outcome of the 20th Knesset. For more insight, read the full Demotrends blog post by Ashira Menashe-Oren the demographics of the Israeli electorate here. The map has been done using ggmap and ggplot, two simple mapping tools I really like. If you are interested in the code, below you can find the relative syntax and data.
To start upload the libraries:
library(maptools) #reads the shape file
library(ggmap)
library(ggplot2)
Download the shape file (I normally use Diva-GIS website) and read it:
map.ogr<- readOGR(".","ISR_adm1")
Data set:
df <- structure(list(lon = c(35.148529, 35.303546, 34.753934, 34.781768,34.989571, 34.824785, 34.808871, 34.883879, 34.844675, 34.90761, 35.010397, 34.871326, 35.21371, 34.655314, 34.887762, 34.792501, 34.574252, 34.791462, 34.748019, 34.787384, 34.853196, 34.811272, 34.919652, 34.888075, 35.098051, 35.119773, 34.872938, 34.835226, 34.988099, 35.002462), lat = c(32.517127, 32.699635, 31.394548, 32.0853, 32.794046, 32.068424, 32.072176, 32.149961, 32.162413, 32.178195, 31.890267, 32.184781, 31.768319, 31.804381, 32.084041, 31.973001, 31.668789, 31.252973, 32.013186, 32.015833, 32.321458, 31.892773, 32.434046, 31.951014, 33.008536, 32.809144, 31.931566,32.084932, 31.747041, 31.90912), City = structure(c(30L, 19L,24L, 29L, 9L, 25L, 7L, 11L, 10L, 14L, 16L, 23L, 13L, 1L, 21L,28L, 2L, 4L, 3L, 12L, 20L, 27L, 8L, 15L, 18L, 22L, 26L, 6L, 5L, 17L), .Label = c("Ashdod", "Ashkelon", "Bat yam", "Beersheva", "Beit Shemesh", "Bnei brak", "Giv'atayim", "Hadera", "Haifa", "Herzliyya", "Hod HaSharon", "Holon", "Jerusalem", "Kefar Sava", "Lod", "Modi'in - Makkabbim - Re'ut", "Modi'in Illit", "Nahariyya", "Nazareth ", "Netanya", "Petach Tikva", "Qiryat Atta", "Ra'annana", "Rahat", "Ramat gan", "Ramla", "Rehovot", "Rishon", "Tel-Aviv", "Umm Al-Fahm"), class = "factor"), most.votes = c(96.28, 91.41, 87.62, 34.03, 24.98, 30.93, 40.1, 38.77, 34.2, 34.66, 28.95, 32.75, 23.9, 30.96, 27.87, 29.78, 39.31, 37.17, 32.88, 30.86, 33.14, 26.95, 31.77, 32.22, 34.25, 35.01, 39.1, 57.56, 27.89, 71.63), party = structure(c(1L, 1L, 1L, 2L, 2L, 2L, 2L, 2L, 2L, 2L, 2L, 2L, 3L, 3L, 3L, 3L, 3L, 3L, 3L, 3L, 3L, 3L, 3L, 3L, 3L, 3L, 3L, 4L, 4L, 4L), .Label = c("joint list", "labour", "likud", "yahadut hatora"), class = "factor")), .Names = c("lon", "lat", "City", "most.votes", "party"), class = "data.frame", row.names = c(NA, -30L))
get the map using get_map
gmap <- get_map(location=c(34.2,29.4,36,33.5),zoom=7,source="stamen",maptype="watercolor")
and plot the map:
ggmap(gmap)+

geom_polygon(aes(x = long, y = lat, group=id), data = map.ogr, color ="blue", fill ="white", alpha = .8, size = .4)+

geom_point(aes(x=lon,y=lat,color=party,size=most.votes),data=df)+ scale_colour_discrete("Coalition", labels = c("Joint List",
"Labour","Likud","United Torah Judaism"), breaks = c("joint list",
"labour","likud","yahadut hatora")) +
scale_size_continuous("Coalition", labels = c("Joint List",
 "Labour","Likud","United Torah Judaism"), breaks = c("joint list",
"labour","likud","yahadut hatora"), range=c(10,15), guide = FALSE)+
theme(axis.text=element_text(size=18),
plot.title=element_text(size=rel(3)),
legend.key = element_rect(fill = "white"),
legend.background =element_rect("white"),
legend.text = element_text(size = 25),
legend.title = element_text(size = 25))+
guides(colour = guide_legend(override.aes = list(size=8)))+
labs(x="",y="")
 If you want to add city names you can use the “annotate” option, adding the code below after
 guides(...)+. I have modified the coordinates to avoid overlapping of labels and colored names to match the color of the winner party.
annotate("text", x=c(35.14853+ 0.2,35.21371+0.15,35.00246+ 0.15,34.79146+0.15, 34.98957-0.08,34.78177-0.14),
y=c(32.51713,31.76832,31.90912,31.25297, 32.79405,32.08530),
size=5,font=3,
label=c("Umm Al-Fahm","Jerusalem","Modin  Illit",
"Beersheva","Haifa","Tel Aviv"),
color=c("darkred","blue4","deeppink4", "blue4",
"springgreen4","green4"))+
For beginners I highly recommend ggplot2 mailing list, a great and shame-free place to learn.
